Why Your “Average” Workout Might Be Lying: A Friendly Guide to Moving Averages
Daily numbers jump around. Moving averages smooth the noise so you can spot real trends in fitness, budgets, work metrics, and more—without needing math skills.
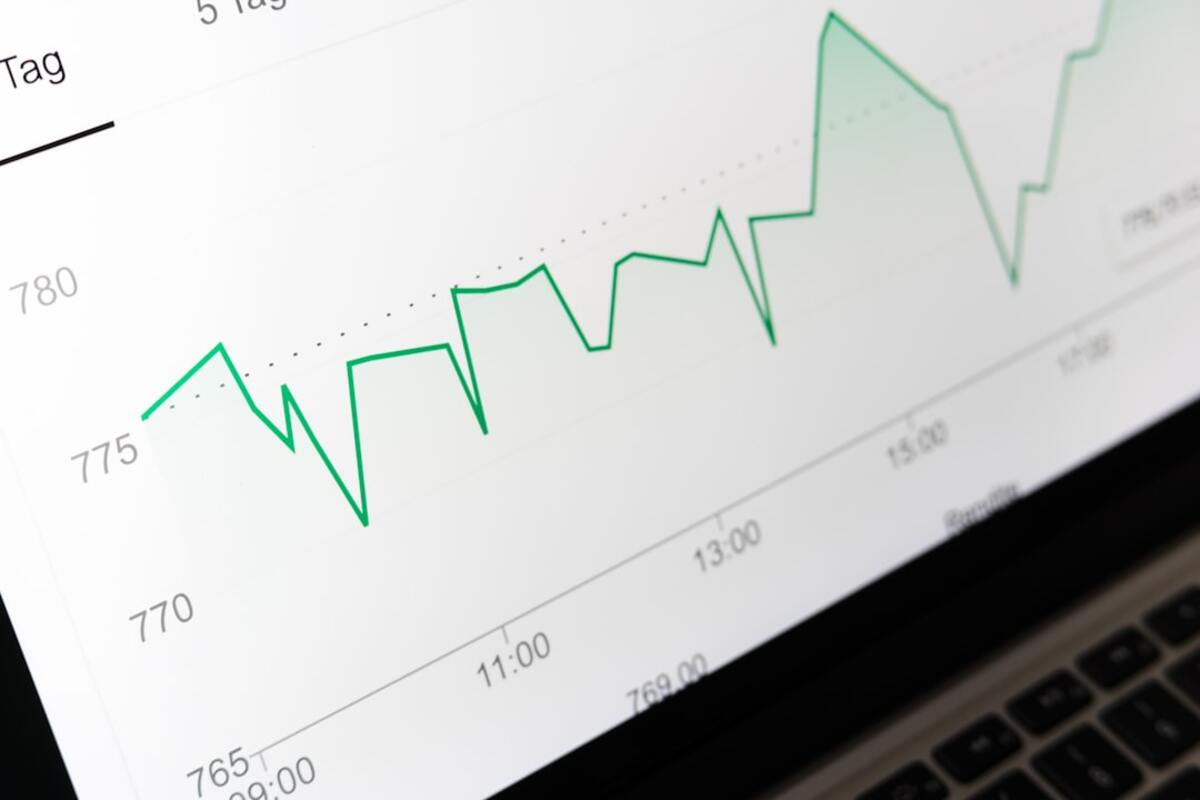
- A moving average turns messy day-to-day numbers into a clearer trend line you can actually act on.
- Different windows (7-day, 30-day) answer different questions—short windows react fast, longer ones show the bigger picture.
- Common traps—like comparing raw numbers to smoothed ones—can make you think you’re improving (or failing) when you’re not.
“I’m doing everything right… so why does my progress look worse?”
Imagine you start tracking your workouts. On Monday you do 9,000 steps. Tuesday: 12,500. Wednesday: 6,200 (it rained). Thursday: 11,300. Friday: 8,100. When you look at the week, your chart looks like a set of stairs in an earthquake.
This is where lots of people give up on tracking. The numbers feel moody. One day you’re “crushing it,” the next day you’re “falling behind.” But the truth is: daily life is noisy. Weather, meetings, sleep, travel, a surprise dinner—your daily data is full of perfectly normal randomness.
Analytics has a simple tool for this: the moving average. It doesn’t make your data “better.” It makes it easier to read.
A moving average answers a very human question: “If I zoom out just a little, what’s really happening?”

Moving average, explained like a kitchen trick
Think of tasting a soup. If you take one spoonful, you might hit a salty pocket and think the whole pot is ruined. If you stir and taste again, you get a more reliable sense of the flavor.
A moving average is the “stirring.” Instead of judging your progress by one day, you average the last few days together.
Here’s the basic idea:
- Pick a window (like 7 days).
- Average the most recent 7 values.
- Move forward one day and do it again (drop the oldest day, add the newest).
The result is a smoother line that’s less reactive to random spikes and dips.
A small, real-life example (steps):
| Day | Steps (raw) | 3-day moving average |
|---|---|---|
| Mon | 9,000 | — |
| Tue | 12,500 | — |
| Wed | 6,200 | (9,000 + 12,500 + 6,200) / 3 = 9,233 |
| Thu | 11,300 | (12,500 + 6,200 + 11,300) / 3 = 10,000 |
| Fri | 8,100 | (6,200 + 11,300 + 8,100) / 3 = 8,533 |
Notice what happened: Wednesday’s ugly dip (6,200) still matters, but it doesn’t get to “shout over” your whole week. The moving average translates day-to-day chaos into something closer to your true routine.
In practice, people use moving averages everywhere:
- Fitness: weight, steps, running pace, sleep duration
- Money: daily spending, account balance, subscriptions
- Work: support tickets, sales leads, website visits, shipping volume
- Life tracking: mood ratings, screen time, caffeine intake
It’s not a “business-only” technique. It’s a sanity tool for any repeating measurement that wiggles.
Picking the right window: 7-day vs 30-day (and why both can be true)
The window size is the personality of your moving average. It decides what counts as “noise” and what counts as “signal.”
- Short window (3–7 days): reacts quickly, great for spotting sudden changes, but still bouncy.
- Medium window (14 days): smoother, helpful for routines that vary by weekdays/weekends.
- Long window (30 days or more): very stable, great for long-term direction, but slow to notice a new trend.
Here’s a relatable scenario: you’re trying to reduce takeout meals.
Week 1 goes well. Week 2 you have guests and order in three times. Week 3 you’re back on track. If you watch only daily counts, you’ll feel like your habit is constantly failing. If you watch a 7-day moving average, you’ll see the guest week as a bump. If you watch a 30-day moving average, you’ll see whether your lifestyle is changing overall.
Often the best approach is to use two moving averages at once:
- Fast line (7-day): “What’s happening lately?”
- Slow line (30-day): “Where am I headed?”
This is why many apps and dashboards show “last 7 days” and “last 30 days” side by side. They’re not competing; they’re answering different questions.
One important detail people miss: a weekly pattern can make raw numbers look dramatic even when nothing is changing. For example, many people walk less on Sundays or spend more on Fridays. A 7-day moving average naturally “respects” the week cycle, which makes it easier to compare one week to the next.
Rule of thumb:
- If you have a clear weekly rhythm (workweek/weekend), start with a 7-day moving average.
- If you’re tracking something more “monthly” (rent, big bills, project cycles), try 30-day or 4-week.
And if you’re thinking, “But won’t smoothing hide important changes?”—it can, which is why you should know a few common traps.
If yesterday’s steps were 6,000 but your 7-day average is 9,200, it can feel like you “failed.” You didn’t. You had one low day. Compare raw-to-raw (yesterday vs yesterday) or smooth-to-smooth (this week’s average vs last week’s average). Mixing them creates unnecessary emotional whiplash.
If yesterday’s steps were 6,000 but your 7-day average is 9,200, it can feel like you “failed.” You didn’t. You had one low day. Compare raw-to-raw (yesterday vs yesterday) or smooth-to-smooth (this week’s average vs last week’s average). Mixing them creates unnecessary emotional whiplash.
A moving average is always partly made of older data. If you dramatically improve this week, a 30-day average will be slow to celebrate. If you dramatically slip this week, it will be slow to warn you. That’s not a bug—it’s the tradeoff you made for stability.
A practical fix: keep a short window (like 7-day) for early warnings and a longer window (like 30-day) for steady direction.
A moving average is always partly made of older data. If you dramatically improve this week, a 30-day average will be slow to celebrate. If you dramatically slip this week, it will be slow to warn you. That’s not a bug—it’s the tradeoff you made for stability.
A practical fix: keep a short window (like 7-day) for early warnings and a longer window (like 30-day) for steady direction.
If your question is “Am I consistent this week?” a 90-day average is too calm to help. If your question is “Is my budget trending up this year?” a 3-day average is basically a weather report. Match the window to the decision you want to make.
If your question is “Am I consistent this week?” a 90-day average is too calm to help. If your question is “Is my budget trending up this year?” a 3-day average is basically a weather report. Match the window to the decision you want to make.
There’s also a subtle psychological benefit here: moving averages reduce the urge to overreact. They make you less likely to change your plan because of one weird day—like cutting calories aggressively after a single higher weigh-in, even though the overall trend is fine.
To make this even more concrete, consider weight tracking. Weight can swing daily due to water, salt, stress, and sleep. A moving average doesn’t pretend those swings aren’t real—it just stops them from hijacking your interpretation.
A quick “trend reading” checklist:
- Raw line: good for understanding daily life (“What happened on Wednesday?”).
- Moving average line: good for decisions (“Is my habit improving?”).
- Use both: raw for context, smoothed for direction.
If you’ve ever felt like your numbers were “messing with you,” a moving average is often the first step toward turning tracking into something calmer and more useful—whether you’re watching a personal habit, a team metric, or a home budget.